Visual Neuroscience (2003), 20, 501-510.
Printed in the USA. Copyright© 2003
Cambridge University Press 0952-5238/03
$ 16.00 DOI: I 0.10 I 7/S0952523803205046
Hyper-vision in a patient with central and paracentral vision loss reflects cortical reorganization
Clara Casco, Gianluca Campana, Alba Grieco, Silvana Musetti and Salvatore Perrone
Abstract
SM, a 21-year-old female, presents an extensive central scotoma (30 deg) with dense absolute scotoma (visual acuity .cc 10/100) in the macular area (10 deg) due to Stargardt's disease. We provide behavioral evidence of cortical plastic reorganization since the patient could perform several visual tasks with her poor-vision eyes better than controls, although high spatial frequency sensitivity and visual acuity arc severely impaired. Between 2.5-dcg and 12-dcg eccentricities, SM presented (I) normal acuity for crowded letters, provided stimulus size is above acuity thresholds for single letters; (2) a two-fold sensitivity increase (d-prime) with respect to controls in a simple search task: and (3) largely above-threshold performance in a lexical decision task carried out randomly by controls. SM's hyper-vision may reflect a long-term sensory gain specific for unimpaired low spatial-frequency mechanisms, which may result from modifications in response properties due to practice-dependent changes in excitatory/inhibitory intracortical connections.
Keywords: Cortical plasticity, Macular scotoma
Introduction
In normal subjects, the fovea, where cone density is high, shows exceptional high spatial resolution, and guarantees normal scene recognition. Patients with retinal and macular disease have disrupted central vision. Central visual-field losses have been re ported to impair visual performance, sometimes severely, in reading (Legge et al., 1985), face recognition (Peli et al., 1991 ), and visual search (Schuchard & Fletcher, 1994). Visual functions such as contrast sensitivity (Mitra. 1985), contrast discrimination (Schuchard, 1992), stereoscopic depth perception (Raasch, 1992), and fixation precision stability (Schuchard, 1997) arc also impaired with central and sometimes parafoveal scotomata.
Vision limited by an artificial scotoma (a small mask occluding part of the visual field) has been investigated (Ramachandran & Circgory, 1991) while a dynamic pattern (i.e. random visual noise) is presented over a surrounding region. The artificial scotoma produces perceptual filling-in and misperception of position (Kapadia et al., I994), indicating that receptive fields inside the scotoma region respond to stimuli located outside it, and suggesting that alterations of the retinal input in adult humans may result cortical plasticity. In support of this suggestion, Braun et al. (200 I) showed that lesions in the peripheral visual system induce disinhibition due to changes in intracortical connectivity, resulting in increased cortical activity. A similar observation was also made in retinal lesion experiments in animals: changes in the adult primary visual cortex can occur as a result of retinal lesions (Chino et al., 1992; Pettet & Gilbert, l 992; De Wecrcl et al.. 1995). The outcome is either relative response gain or receptive-field expan sion of neurons inside the scotoma rendering them selective to stimulation around the receptive field. Simulation studies also support the suggestion that cortical neurons selective to visual stimuli in the area of the visual field corresponding to the retinal lesion may become selective to other parts of the visual field (Xing & Gerstein, 1994; Kalarickal & Marshall, 1999. 2002; Xing & Heeger, 2000; Andrade et al., 200 I). If similar plasticity effects occurred in patients with central scotoma, they would probably lead to a relative modification in filtering properties of neurons in silenced cortical area, or else to a relative response gain.
The idea that plasticity may lead to response gain is compatible with spontaneous reduction of impairment, often observed in patients with visual-field loss (Safran & Landis, 1996; Sunness et al., 2000). This reduction in impairment concerns several visual functions. Sunness et al. (2000) found that patients with bi lateral et al. (1985) found that scanning and reading performance (accuracy), when patients learn to use extrafoveal retinal loci, was not affected by their large scotomata.
In addition to plasticity phenomena resulting from disinhibition of long-range excitatory influences, other plasticity phenomena 1rny occur consequent to the extensive use of peripheral retinal loci where vision is unimpaired. This suggestion comes from studies on perceptual learning in humans, demonstrating that practice-dependent improvement exists, can persist for several months, and is specific for stimulus, task, and retinal locus of stimulation. These effects have been explained on the basis of neural plasticity, consisting in practice-dependent structural and long-term modifications of a number of properties of the mechanisms activated by the learning task, most notably spatial frequency and orientation selectivity (Kami & Sagi, 1991, 1993; Ahissar & Hochstein, 1993, 1996, 1997; Casco & Campana, 2001; Campana & Casco, 2003).
These training-dependent plasticity mechanisms could account for improved performance with respect to the normal eye, rather than simply reduced impairment. The aim of the present study was therefore to ascertain whether in a patient with central visual loss, the use of extrafoveal retinal loci in everyday life to sec stimuli that normal subjects view centrally could render these loci more sensitive to these stimuli.
To address the issue of whether cortical plasticity could account for visual improvement in a patient (SM) with macular disease, we checked whether performance was better in her poor-vision eye than in the normal eye, when stimuli were presented on the para fovea.
We asked not merely whether the visual functions of this patient were less impaired than would be expected from visual field loss, but whether a patient with macular disease could sec that which controls failed to sec. SM, the patient, is a girl presenting Stargardt's dystrophy, a pathological condition involving tissue deterioration at the center of the retina. In this disease, photoreceptors in the macula undergo a degenerative process, first causing a decline and leading to a loss of central (paracentral) vision whereas peripheral vision is preserved. We measured the patient's performance in contrast sensitivity, lexical decision, crowding, and simple visual-search tasks. Stimulus size was at or above threshold for controls at the eccentricities tested.
Materials and methods
Patient
SM is a 21-year-old female with a pre-university education, who in September 1997 began to complain of severe photophobia and had to wear sunglasses. Initially she did not notice visual-acuity loss. She was admitted to the hospital of the Department of Neuroscience (ophthalmology section) of the University of Pisa, and discharged on 5 November of the same year with a diagnosis of Stargardt's disease.
At the first objective examination (1997), the macula had a severe granular appearance. Foveolar light reflex was not observable. In the macular region, small grey-yellow spots were evident. The best-Corrected visual acuity with - 1.25 sf in both eyes was 10/100, in tests performed from 1997 to 2002.
Encephalic magnetic resonance (MR) carried out twice (1997 & 1998) showed no areas of altered signal in the parenchymal region. Optic nerves, chiasm, optic tract, and central optic pathway showed no significant alterations. Electroretinogram (ERG) from diffused flash recorded in both eyes in 1997 showed a small reduction in photopic response to stimulation with diffuse flash in the left eye but a drastic reduction in the response amplitude to a stimulus pattern (checkerboard) in both eyes. ERG results indicated macular dysfunction in the absence of diffuse alterations of retinal function.
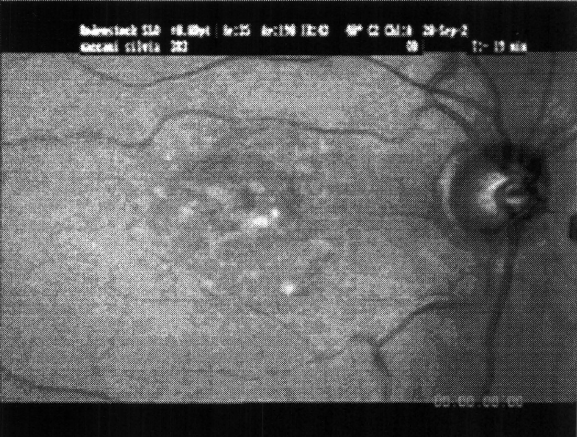
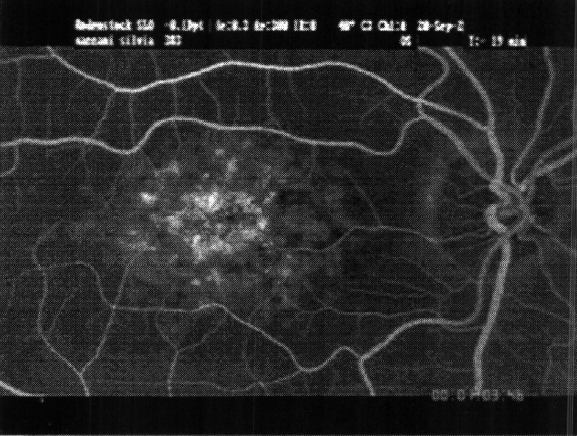
Fluorescein digital angiographics ( I 997, 1998, 200 I, & 2002) showed evident hyper-fluorescent areas in each macular region due to atroph ic changes within the retinal pigmented epithelium (RPE) (Fig. 1). On the basis of the alterations detected by fluoresccin angiography, a diagnosis of Stargardt's disease was made.
Visual evoked potential (VEP) response (1998) was elicited only with stimuli of maximum angular amplitude. The P100 component was badly shaped and had reduced amplitude and increased latency.
Computerized visual fields (Humphrey System, confinned by GHT, program 32), performed in 1998- 2002, showed in both right and left eye a central absolute scotoma 10 deg wide (5 deg of radius) with surrounding area of severe hypo-sensitivity (relative scotoma) of about 10 deg of radius in all quadrants.
Method
In all experiments, we compared performance of normal subjects and SM for different visual tasks with stimuli presented in paracentral vision. Pre-tests were carried out to ensure that, in normal subjects, perfornance was above threshold at the eccentricities tested. These ranged from 2.5 deg (for lexical decision and crowding tests) to more than 10 deg (for visual search and contrast sensitivity). At these eccentricities, SM's visual acuity was very low.
Subject
Controls, matched for age and educational background, presented normal or correted-to-normal vision. All control subjects and the experimental subject SM gave written, informed consent for participating in the experiments, in accordance with the Declaration of Helsinki.
Stimuli
Experiments 1, 2, and 4 were run by means of a PC and the stimuli were presented on a high-resolution monitor with refresh rate no lower than 75 Hz.
Experiment 1
In Experiment 1, we measured the contrast sensitivity in both SM and eight control subjects, in relation to different spatial frequencies, with and without a central artificial scotoma.
The stimulus consisted of luminance sinusoidal gratings, presented on half the screen, while the other half was unifomly grey. Mean luminance of the two screen halves was 18.75 cd/m2 for all stimuli. Stimuli were viewed at 1.5 m from the screen, with fixation on a central dot for 2 s. The task of the observers was to decide, pressing the appropriate key, which of the two screen halves (left or right) contained the grating, according to a two alternative forced choice (2AFC) procedure. A staircase method for determining contrast sensitivity was used, in which the contrast* varied according to accuracy. A session consisted of 20 blocks, and in each block eight different steps (values of spatial frequency: 0.1, 0.4, 1, 3, 7.9, 14.5, 21.8 and 29.1 cycles/deg) were presented in random order. The contrast value in the first block was set, for each spatial frequency, on the basis of pilot observations on each subject. Then the block was repeated in accordance with the following rule. If in the previous block, response at a given spatial frequency was correct, then the contrast was reduced by one step (2 dB), while if the response was incorrect it was increased by one step. The contrast sensitivity was determined by averaging the contrast value or the last ten reversals.
a
b
Fig. 1. (a) Posterior pole view of SM's right eye; (b) Fluorescein angiogram in late venous phase shows a central area of hyperfluorescence caused by atrophic changes of the retinal pigmented epithelium (RPE).
Experiment 2
In Experiment 2, observers performed a lexical decision task. Stimuli were viewed binocularly at 38-cm viewing distance. In each trial, the stimulus consisted of a fixation mark and a string of lower case letters presented at either 2.5-deg or 5-deg eccentricity under independent conditions. Individual characters subtended 25 arcmin horizontally and ranged from 36' to 54' vertically. Center-to-center letter separation was equal to 30'. The experiment consisted of one block of 40 trials, in which the string was either a word or a non-word with equal probability. Non-words were obtained by randomly substituting one letter of the word so as to obtain an "illegal" non-word that violated the most basic rules of Italian grammar, thus making the lexical decision task relatively easy. Two word-length conditions were tested (3 and 5 letters) and for each word length, t\vo subtypes of word string were used: five were words of high frequency, while five were of low frequency (De Mauro, 1991). The procedure was as follows. First a blank screen was presented for 300 ms, followed by a fixation dot shown for 1000 ms. The stimulus was then presented after a 100-ms interval and remained on screen until the subject responded. A feedback for errors was given. The interval between subject responses and the beginning of successive trials was 800 ms. The observer's task was to maintain fixation and make a lexical decision, indicating whether the string was a word or a non-word by pressing the appropriate key. Eye movements were monitored on a mirror placed in front of subject's eye. A mark was placed on the mirror in correspondence of a distance from fixation of 1.5 deg. Pilots ensured that eye movements larger than this threshold value could be detected on 95% of trials during task execution. Trials on which gaze shift was bigger than 1.5 deg were recorded and rejected off-line. The median number of gaze shifts was one per block (range 0- 5) for both controls and SM.
Experiment 3
In Experiment 3, we measured the extent of crowding effect. Stimuli were presented at an eccentricity of 2.5 deg of visual angle (below a red fixation point). Eye movements were monitored as in Experiment 2. The median number of gaze shifts was one per run (range 0 - S) for both controls and SM. The experiment consisted of presentation of different cards, at 1.5-m viewing distance, containing single or crowded letters (a target letter surrounded by four different letters with interletter distance proportional to letter size).
In the first session, single letters were presented; in the second session crowded letters were presented. The task consisted of naming either the single or the crowded target letter. Each card was labelled as a Snellen measure of visual acuity. A staircase method for determining visual acuity was used. The cards in each block had the same dimension, corresponding to one step of visual acuity. In each block, when two consecutive cards were named correctly. another block with successive step of visual acuity (smaller letters) was presented. When one of two consecutive cards was named correctly and the other incorrectly, presentation of stimuli of that block was continued; when two consecutive cards were named incorrectly, the session was terminated. The Snellen value of visual acuity corresponded to the last step where the subject reported 2/2 or 2/3 of correct responses. No time pressure was imposed on the subjects for this experiment. The two sessions were repeated three times.
Experiment 4
In Experiment 4, we measured the performance in feature search task consisting in searching for a 30-deg oriented bar (target) amongst 45-deg oriented bars (distractors). Bars were 1.13 deg long and 5 arcmin wide and positioned along a virtual ellipse, with major axes 27. 1 deg and 22.6 deg long, on one of the eight points of intersection between the ellipse and the four axes oriented at 0 deg, 45 deg. 90 deg, and 135 deg ( ± a jittering varying randomly from trial to trial from 0 deg to 1.31 deg). Under these conditions, bar eccentricities ranged from 11.3 deg to 13.5 deg. The procedure was as follows: A blank screen (0.2 cd/m2 ) was presented for 100 ms, followed by a 500 ms interval in which the central fixation (red dot: diameter 0 = 0.0025 deg; luminance = 14.3 cd/m2) was presented. A 1000 ms interval was then followed, in which eight small grey circles (diameter = 0.0025 deg, luminance = 16.75 cd/m2) appeared at the bar position, plus a 1000--ms interval in which the grey circles become white (165 cd/m2) for response preparation. After this, the screen turned blank for 550 ms and then the bar elements (165 cd/m2) were presented for 50 ms. This exposure duration is shorter than the latency of saccadic eye movements. The screen then remained blank until the response key was pressed. The experimental session consisted of 96 trials randomly presented, with 16 repetitions of three set sizes (2, 4, and 8 elements) under two stimulus conditions (target present or absent). Observers had to detect target presence.
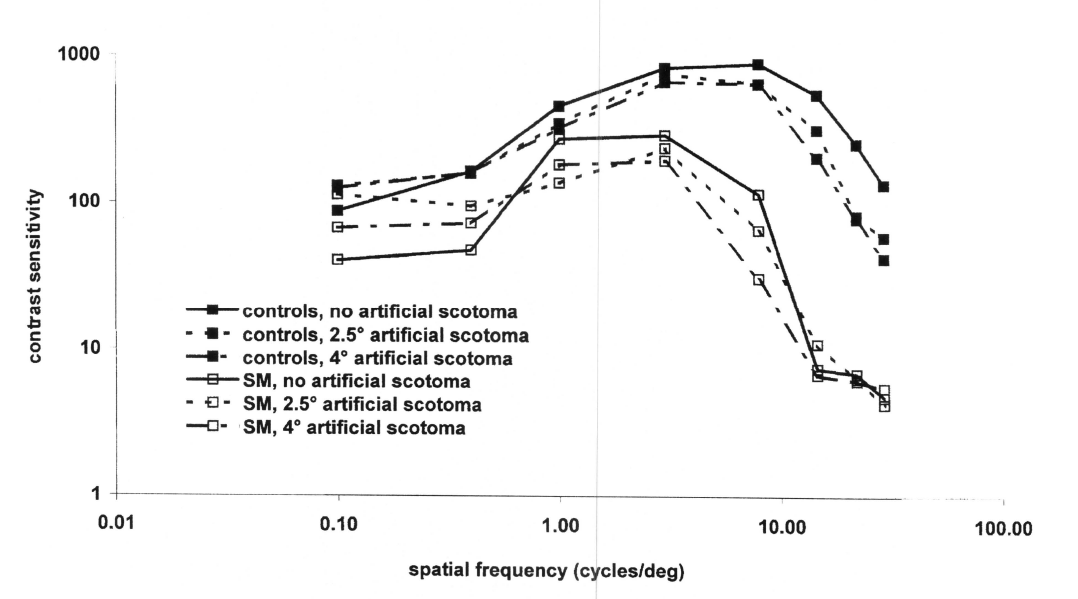
Fig. 2. Contrast sensitivity as a function of spatial frequency in both SM and controls under three conditions (normal viewing and viewing with artificial scotoma of either 2.5 or 4 deg diameter). Cortical plasticity overcomes impaired vision
Results
Experiment 1 Contrast sensitivity
For each subject, SM, and eight controls, contrast sensitivity was measured with and without a central artificial scotoma; this was obtained by placing at the centcr of the stimulus area a disk uf uniform luminance with radius of either 2.5 deg or 4 deg. in Fig. 2, each data point represents contrast sensitivity measured on the basis of an average of ten trials.
SM's performance was compared with control performance by calculating z scores. Scores larger than 1.65 (95% confidence interval) were taken to indicate a significant difference. In the condition without scotoma. SM presented no significant sensitivity reduction with respect to controls for spatial frequencies equal to or lower than 1 cycle/deg (z scores equal to - 1.3, -1.0, and - 1.4 for 0.1, 0.4, and 1 cycles/deg, respectively), whereas a reduction which progressively increases with spatial frequency was found for spatial frequencies equal to or larger than 3 cycles/deg (z scores equal to - 3.4, - 4.3, -2. 1, -1.9, and - 2.2 for spatial frequencies ranging from 3 cycles/deg to 29.1 cycles/deg). Furthermore, the contrast-sensitivity peak is shifted towards the low spatial -frequency range in SM. From these results, we predict that the visual functions that may be preserved in this patient arc those involving the activation of low spatial-frequency mechanisms, since their functioning is not significantly impaired. Moreover, in controls but not in SM, the artificial scotoma (which causes blindness within the scotoma area) progressively reduced contrast sensitivity as spatial frequency increased. To show how a central artificial scotoma affects contrast sensitivity at different spatial frequencies, the data were converted to show foveal gain (Fig. 3), which is the contrast-sensitivity ratio without and with artificial scotoma. A chi-squared technique (with 5% significance level) was used for testing the effects of the 4-degwide artificial scotoma. We found that at 0.4 cycles/deg. the scotoma improves contrast sensitivity significantly in SM but not in normals [x(1) = 5.1; P < 0.05], at 7.9 cycles/deg it reduces contrast sensitivity in SM but not in controls [x(1) = 25.01 ; P < 0.001]; and at 29.1 cycles/deg it reduces contrast sensitivity only in controls [x(1) 0= 4.37; P < 0.05]. For all other data points, the difference between SM and controls is not significant. The foveal-gain effect is interesting since it indicates that SM sees a grating of medium spatial frequencies (7.9 cycles/ deg) better when it stimulates both unimpaired and impaired retinal regions. Thus, depriving residual input in the fovea ,where vision is very impaired reduces sensitivity for medium spatial frequencies in the parafovea. This indicates that residual input from the fovea (visual acuity I 0/100) facilitates the response to eccentric low-medium spatial frequencies.
The foveal gain can be explained by assuming a residual activitv due to the retention of islets of intact vision within the scotoma that were not detected by the computerized visual-field test. Both the shift of contrast-sensitivity peak towards the low spatial-frequency range, as well as the specific loss at low spatial-frequency sensitivity with artificial scotoma, arc compatible with the suggestion that disinhibition of excitatory influences following the scotoma may determine receptive- field expansion in neurons with initial receptive field inside the scotoma (Chino et al., 1992: Pettet &i Gilbert, 1992; Darian-Smith & Gilbert.1995). Indeed, according to this model, changes in center/surround antagonism with consequent modification in basic neuron filtering properties such as spatial-frequency selectivity arc expected.
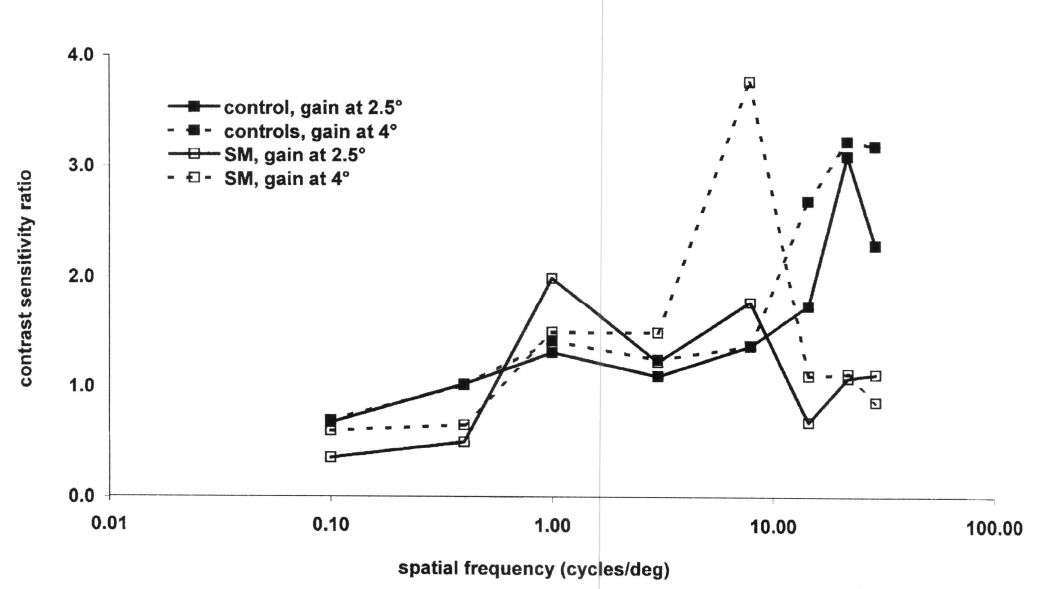
Fig. 3. Foveal gain. defined as contrast sensitivity ratio when gratings are viewed without and with artificial scotoma, as a function of spatial frequencies.
Experiment 2 Lexical decision
To compare SM's performance with that of controls, we used z scores. A value of 1.65 (95% confidence interval) or more is indicative of a significant difference.
When stimuli are presented in the region with higher visual impairment (2.5-deg eccentricity), word/non-word discrimination performance is slightly above chance for controls (n = 9: words: 62.5%; non-words: 73.5%) but is at chance for SM (words: 50%; non-words: 47%). Mean z score is equal to 1.6.
At 5-deg eccentricity, although resolution is still low, lexical decision performance is considerably better for SM (words: 80%; non-words: 75%) than controls (words: 6 1%. non-words: 50.5%). who perform this task at chance. Mean z score is equal to + 2.6.
When comparing the effect of eccentricity in SM and controls (Fig. 4) using a chi-squared technique (with 5% significance level), we found that for controls words/non-word discrimination performance is lower at 5 deg with respect to 2.5-deg eccentricities, whereas for SM it is higher [x(3) = 12.94; P < 0.01].
It has previously been suggested (Cummings et al., 1985) that, although patients with large scotomata have low reading rates, reading accuracy is not necessarily reduced in these subjects. Besides confirming that reading performance is not necessarily impaired in patients with central visual-field loss, our results show that letter-string discrimination is above threshold when presented in the retinal area where controls show random performance. This surprising effect occurs when strings are presented at the edge of the retinal region with important visual-field loss (5-deg eccentricity), where contrast sensitivity for high spatial frequencies is considerably reduced with respect to normal controls. It could be argued that SM viewed the stimulus with a more eccentric-preferred peripheral locus, but this is unlikely, since eye movements were monitored and resolution would be too low at larger eccentricities.
It is interesting to speculate on whether SM's hyper-vision, in a region of low resolution for normal eye, could result from a phenomenon of synaptic plasticity, possibly based on disinhibition of long-range excitatory influences. On the basis of this mechanism, the receptive field in the scotoma interior could become responsive to stimuli presented in the parafovea. However, contrast-sensitivity data show that low spatial-frequency sensitivity, although not reduced, is not high enough to account for hyper-vision. The higher efficiency of SM in this task is difficult to explain without calling into play a Hebbian (training-dependent) mechanism of plasticity, over and above spontaneous plasticity. Extensive training may have produced a long-term modification of the response of low spatial-frequency-sensitive channels, specific for the task. Campana and Casco (2003) have shown that learning produces an increase in response, specific for the orientation of combined features, not only for simple features, suggesting that the underlying mechanism becomes selective, after training, for the specific complex feature trained. Following training, lexical decision tasks can be executed by SM in a region where resolution is very low, by exploiting the information carried from the letter/word envelope better than is achieved by normal observers. Alternatively, SM's hyper-vision could be accounted for by another mechanism of synaptic plasticity based on weakening of center/surround inhibitory interactions of neurons responding to peripheral visual stimuli (Xing & Heeger. 2000). In this case, recognition of single letters in a string would be less affected by the presence of adjacent letters, making string recognition easier.
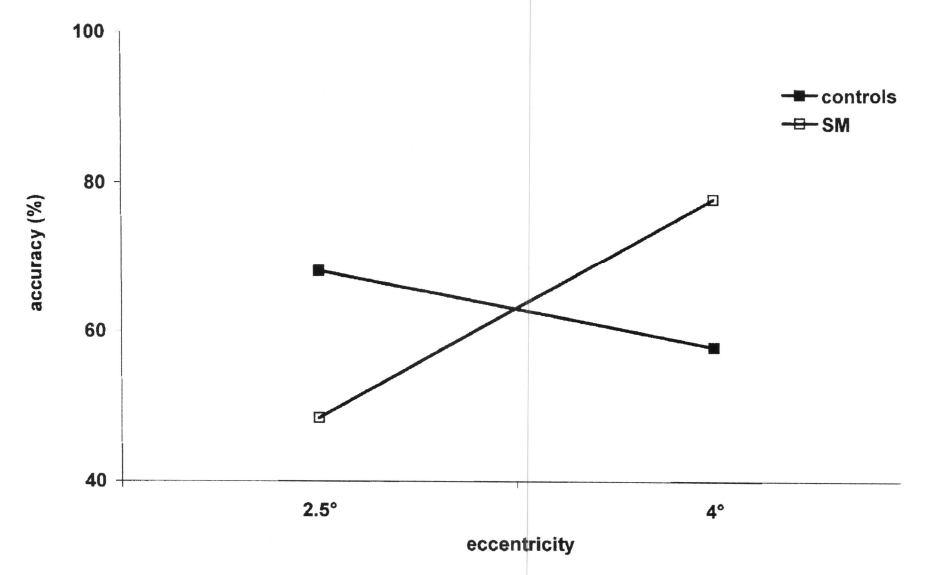
Fig. 4. Mean accuracy in lexical decision for words and non-words for controls and SM.
Experiment 3 Crowding test
Results arc shown in Fig. 5. At 2.5-deg eccentricity, control subjects (n = 9) showed double visual acuity with single letters (3.6 arcmin) compared with crowded letters (7.2 arcmin). Within-subject I-tests were used to compare the performance of control subjects under single- versus crowded-letter conditions. The difference was highly significant (1 = 5.4; P < 0.001). SM's performance was compared with control performance by calculating z scores.
Scores larger than 1.65 (95% confidence interval) were taken as indicative of a significant difference. SM's perfomance was significantly worse than controls for single-letter visual acuity (6 arcmin; z = -3.7), a result compatible with the contrast sensitivity reduction for high spatial frequencies. However, SM's visual acuity for crowded letters did not significantly differ from that of controls (6.6 arcmin; z = 0.19). Thus, in the region with central-field loss, where SM presented a large reduction in contrast sensitivity for high spatial frequencies, she showed reduced acuity for single letters but not for crowded letters. Note that crowded-letter size is quite large and docs not require high resolution. The absence of impairment under the crowded condition suggests that the ability of segregating the target from background elements is intact in SM.
The ability of SM to sec crowded letters in the region of the scotoma as normal subjects confirms the results of Experiment 2, namely that SM is very efficient in letter recognition on the basis of low spatial-frequency information, which is relatively unimpaired. The use of low spatial-frequency information to discriminate letters in the parafovea on the basis of their envelope (defined as the small polygon without indentation around a letter) has also been demonstrated in normal observers (Jacobs et al., 1989). It is unlikely that SM used more peripheral-preferred loci because eye movements were monitored and because the crowding effect is much larger in the periphery than in the parafovea, and resolution is lower.
SM's normal performance in this task suggests that crowding mechanisms arc not affected in the region with large visual loss. In normal viewing, crowding arises because target and distractors arc analyzed together through a coarse-scale mechanism such that the output of channels activated by target arc suppressed by surrounding distractors. Indeed, crowding can be reduced by lowering the scale of spatial-frequency analysis (Morgan et al., 1998). Our results suggest that SM is normally efficient in minimizing crowding effects by limiting the scale of spatial-frequency analysis to the size of the target letter, maybe through reduction of surround suppression (Xing & Hecgcr, 2000).
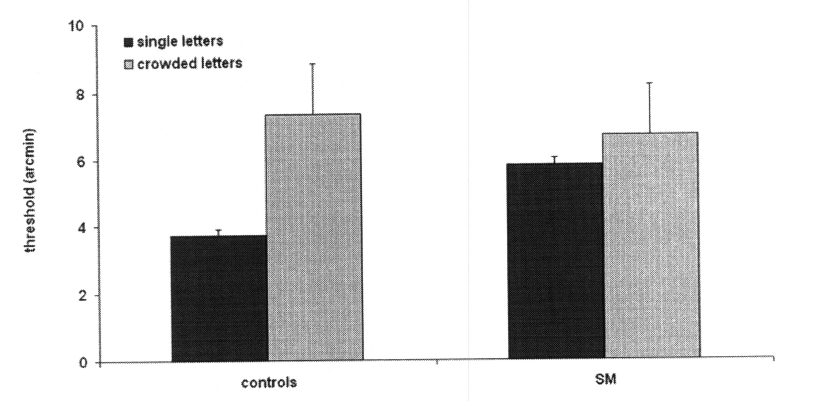
Fig. 5. Thresholds for single and crowded letter identification for controls and SM.
Experiment 4 Simple visual search
Accuracy data were transformed into d-prime values, a measure of sensitivity used within the signal detection theory (SDT) framework. indicating the ability to distinguish signal (target present) from noise (target absent) on the basis of rate of correct hits ("present" responses) and correct rejections ("absent" responses).
In the control group (n = 12), d-prime for detecting the presence of a target, which differs from a background element on the basis of a small orientation gradient, docs not depend on the number of elements displayed (display set size).
SM and control performances were compared by calculating z scores (with 1.65 significance level), independently for each set size. SM shows a set-size effect (Fig. 6): performance is not worse than that of controls for medium and large set size and is significantly better than that of controls for smallest set size (z scores arc equal to + 0.11, - 0.35, and + 1.65. respectively). Results show that, for smallest set size, SM is much better than controls in this task. Although resolution is low at these eccentricities, SM's sensitivity in segregating the target from background on the basis of very small orientation differences (15 deg) is twice normal. This is probably due to extensive training to perform visual tasks in the periphery. Training could have produced a long-term modification in lateral interactions between peripheral units. The absence of impairment with large set size when stimuli arc presented in a region of low resolution can result from SM's ability to minimize the effect neighboring elements so as to limit the analysis to the size of the element in the display through a reduction of surround suppression (Xing & Heeger, 2000). Hyper-vision with small set size may arise from a large increase of response gain or from an increased ability to shift spatial attention when spatial uncertainty is reduced (there are few elements on the search display) (Palmer, 1994).
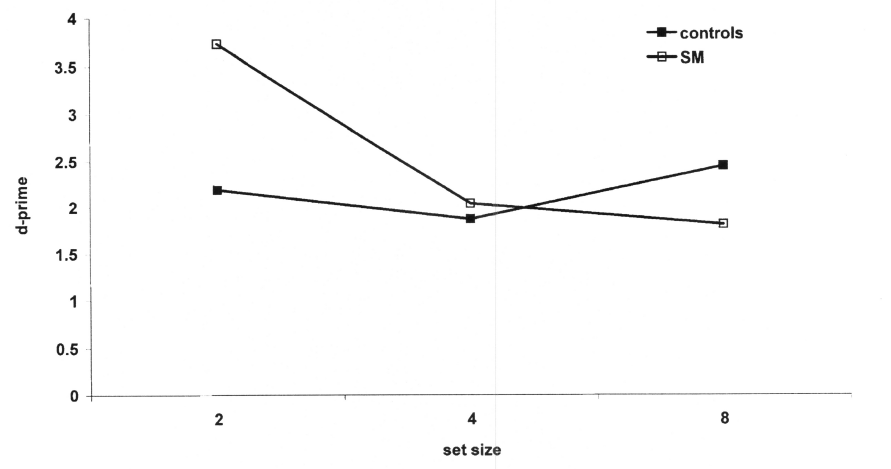
Fig. 6. Threshold (d-prime) as a function of display size in a visual search task with peripherally presented stimuli for SM and controls.
Conclusion
In all experiments, we compared visual functions in the parafoeca and retinal periphery in normal subjects and in one subject with macular degeneration.
Our results show that SM's contrast sensitivity is impaired. though not for low spatial frequencies, and that the contrast sensitivity peak is shifted towards the low spatial-frequency range. SM's performance in detecting low spatial frequencies (i.e. sinusoidal luminance-defined gratings) improved when stimuli are presented in both unimpaired and impaired visual fields. Our results also show that when word and non-word strings were presented in the retinal region with important contrast-sensitivity impairment (for medium and high spatial frequencies), SM showed a lexical decision performance considerably above threshold, whereas normal controls failed in this task. Another interesting result is that SM's visual acuity for crowded letters did not significantly differ from that of controls. Finally, SM was better than controls in searching for a target on the basis of orientation differences when there arc few items in the search display.
How is hyper-vision explained? Our results are compatible with the suggestion that, following the scotoma, a phenomenon of synaptic plasticity has occurred. A well-known phenomenon of synaptic plasticity is that stimulating the region outside the scotoma may cause a reduction of inhibition and consequent unmasking of long-range normally inactive input from the visual field (Andrade et al., 2001; Braun et al., 2001; Calford, 2002). The receptive fields inside the scotoma would be boosted in their expanded state, responding to positions outside the scotoma. Such a mechanism can account for some of our data, for example, that the artificial scotoma reduced sensitivity for lower spatial frequencies in SM than for normal observers. This may be accounted for by reduced inhibition, assuming residual activity due to the retention of islets of intact vision within the scotoma not detected by the computerized visual-field test. The shift of contrast-sensitivity peak towards the low spatial-frequency range can also be explained by this mechanism.
On the basis of the evidence of synaptic plasticity just discussed, one might speculate that reduced inhibition may be associated with an increase in receptive-field size and/or a sensory gain ( DeAngelis et al., 1995) of cells inside the scotoma as well as a change in the center/surround receptive-field properties of peripheral cortical cells. Indeed, disinhibition could account for hyper-vision phenomena if it rendered peripheral neurons less affected by inhibitory contextual interactions that strongly suppress their response in normaI vision (Xing & Heeger, 2000). If reduced inhibition rendered peripheral neurons more sensitive to fine details, this would account for the relative reduction of impairment in tasks such as reading, visual search, and crowding in a region where contrast sensitivity for medium and high spatial frequencies is abnormal in SM.
A very interesting issue is the extent to which the use of the parafovea to perform lexical decision and visual search in everyday life may have led to long-term neural modifications specific for the task. It has often been suggested that, following training. patients with central scotoma may have learnt to quickly shift fixation (and/or attention) towards peripheral targets, or may have allowed better control of accommodative processes ( Beard et al., 1995). These changes in seeing after retinal degeneration are consistent with those resulting in improved visual functions in patients with central scotoma (Sunness et al., 2000). However, this explanation may account for reduced impairment, not hyper-vision.
Another possibility is that training may have resulted in learning to direct attention to parafoveal location. Sustained attention enhances perception in eccentric positions in the visual field, and this may help patients with foveal vision loss to develop a peripheral "preferred retinal locus" (Altpeter & Trauzettel-Klosinski, 2000). However, this explanation may account for reduced impairment in our patient, but not hyper-vision.
The phenomenon of hyper-vision suggests instead that a Hcbbian mechanism has produced long-term modifications in the perceptual system that arc manifest after days or months.
Recent findings support this suggestion. It has been shown that receptive-field changes may take place by strengthening of synaptic inputs at the recovered cells in a Hebbian way, a phenomenon that can be related to preattentive perceptual learning (Eyding et al., 2002). Hyper-vision may be explained if training the parafovea in everyday Iife with visual search and reading tasks changed the responsiveness of the visual mechanisms activated in the parafovea. Visual training may have induced long-lasting behavioral improvement restricted to the trained visual feature and trained location in visual field and specific for the underlying visual mechanisms activated by the task. Both indirect (Karni & Sagi, 1991, 1993; Ahissar & Hochstein, 1993, 1996, 1997; Casco & Campana, 2001; Campana & Casco, 2003) and direct (Schwartz et al., 2002) evidence of training-dependent structural modification in the visual cortex has been provided. Recently, it has been suggested that phcnomena of training-dependent plasticity may occur in patients with visual-field loss (Safran et al., 1999).
All these hyper-vision phenomena may be accounted for by assuming a cortical reorganization that produces, possibly through training. a change in response properties such as selectivity and lateral interactions. Such reorganization could account for SM's performance being better than that of normal observers in discriminating signals (target) from noise in these low-resolution regions.
It is interesting to speculate how these hyper-vision phenomena relate to other phenomena of distorted perception (Burke, 1999). Dreher et al. (2001) suggested a close link between intracortical mechanisms underlying the long-term cortical plasticity revealed by retinal lesions (Chino et al., 1992; Pettet & Gilbert, 1992; De Weerd et al., 1995) and (1) the mechanisms underlying a shortterm enlargement of cortical receptive fields observed by artificial scotoma (Pettet & Gilbert, 1992; DeAngelis et al., 1995), and (2) the psychophysical phenomena produced by retinal scotoma in humans (Ramaehandran & Gregory, 1991; Kapadia et al., 1994; Burke, 1999). Both physiological and psychophysical data may be accounted for a loss of activity in inhibitory connections, allowing a neuron with receptive field inside the scotoma to be activated by input coming from the undamaged part of the retina.
In additions to phenomena of distorted vision previously reported, we show that people with central visual-field loss may present phenomena of hyper-vision, which may also be explained in terms or a loss of activity in inhibitory neurons, making peripheral neurons less affected by contextual inhibitory interactions that strongly suppress their response in normal vision (Xing & Heeger, 2000).
Our results suggest that reduced inhibition may occur, not only as a consequence of reduction of input to geniculo-cortical fibers from an impaired area of the visual field, but also as a consequence of Hebbian-like (training-dependent) learning mechanisms which may lead to long-term structural modification in the visual system.
References
-
AHISSAR, M. & HOCHSTEIN, S. (1993). Attentional control of early perceptual learning. Proceedings of the National Academy of Sciences of the U.S.A. 90(12), 5718 - 5722.
-
AHISSAR, M. & HOCHSTEIN. s. (1996). Learning pop-out detection: Specificities lo stimulus characteristics. Vision Research 36(21), 3487 - 3500.
-
AHISSAR, M. & HOCHSTEIN, s. (1997). Task difficulty and the specificity of perceptual learnin g. NaTure 387(6631), 401 - 406.
-
ALTPETER, M.M. & TRAUZETTEL-KlOSINSKI, s. (2000). The importance of sustained attention for patients with maculopathiEs. Vision Research 40, 1539 - 1547.
-
ANDRADE, M.A., MURO, E.M. & MORAN, F. (2001). Simulation of plasticity in the adult visual cortex. Biological CYbernetics 84 (6), 445 - 451.
-
BEARD, B.L., LEVI, D.M. & REICH, L.N. (1995). Perceptual learning in parAfoveal vision. Vision Research 35 (12), 1679 - 1690.
-
BRAUN, C., WEBER. J., SCHIEFER, lJ., SKALEJ, M. & DIETRICH, T. (2001). HypErexcitalory activity in visual cortex in homonymous hemianopia after stroke. CLINICAL Neurophysiology 112 (2), 336 - 343.
-
BURKE, W. (1999). Psychophysical observations concerned with a foveal lesion (macular hole). Vision Research 39, 2421 - 2427.
-
CALFORD. M.B. (2002). Dynamic representational plasticity in sensory cortex. Neuroscience 111 (4). 709 - 738.
-
CAMPANA, G. & CASCO, C. (2003). Learning in combined-features search: Specificity to orientation. Perception and PSYCHOPHYsics 65, 1197 - 1207.
-
CASCO, C. & CAMPANA. G. (2001). Stimulus specific dynamics of learning in conjunction search tasks. Visual Cognition 8, 145- 162.
-
CHINO. Y.M., KAAS, J.H ., SMITH. E.L., III, LANGSTON, A.L. & CHENG. H. (1992). Rapid reorganization of cortical maps in adult cats following restricted deafferentation in retina. Vision Research 32 (5), 789 - 796.
-
CUMMINGS, R.W., WHITTAKER, S.G., WATSON. G.R. & Bunn, J.M. (1985). Scanning characters and reading with a central scotoma. American Journal Of Optometry and PhYsiological Optics 62 (12). 833 - 843.
-
DARIAN-SMITH, C. & GILBERT, C.D. (1995). Topographic reorganization in the striate cortex of the adult cat and monkey is cortically mediated. Journal of Neuroscience 15, 1631 - 1647.
-
DEANGELIS. G.C., ANZAI, A., 0HZAWA, I. & FREEMAN, R.D. (1995). Receptive field structure in the visual cortex: Does selective stimulation induce plasticity? ProceediNgs of the National AcademY oF Sciences oF the U.S.A. 92 (21), 9682- 9686.
-
DE MAURO, T. (1991). Dizionario di base deLla lingua ItaliaNa (Ed.). Roma: Editori Riuniti, 2a ed.
-
DE WEERD, P., GATTASS. R., DESIMONE., R. & UNGERLEIDER. L.G. (1995). Responses of cells in monkey visual cortex during perceptual filling-in of an artificial scotoma. NaTure 377 (6551), 731 - 734.
-
DREHER, B., BURKE, W., CALFORD, M.B. (2001). Cortical plasticity revealed by circumscribed retinal lesions or artificial scotomas. Progress in Brain Research 134, 217 - 246.
-
EYDING, D., SCHWEIGART, G. & EYSEL, U.T. (2002). Spatio-temporal plasticity of cortical receptive fields in response to repetitive visual stimulation in the adult cat. Neuroscience 112 (1), 195 - 215.
-
JACOBS, A.M., NAZIR. T.A. & HELLER. O. (1989). Perception OT lowercase letters in peripheral vision: A discrimination matrix based on saccade latencies. Perception and Psychophysics 46 (1), 95 -102.
-
KALARICKCAL, G.J. & MARSHALL, J.A. (1999). Models of receptive-field dynamics in visual cortex. Visual NeURoScieNce 16 (6). 1055 - 1081.
-
KALARICKCAL. G.J. & MARSHALL, J.A. (2002). Rearrangement of receptive field topography after intracortical and peripheral stimulation: The role of plasticity in inhibitory pathways. Network 13 (1), 1 - 40.
-
KAPADIA. M.K., GILBERT, C.D. & WESTHEIMER. G. (1994). A quantitative measure for short-term cortical plasticity in human vision. Journal ol Neuroscience 14 (1), 451 - 457.
-
KARNI, A. & SAGI, D. (1991). Where practice makes perfect in texture discrimination: Evidence for primary visual cortex plasticity. Proceedings oF The National Academy oF Sciences oF The U.S.A. 88 (11). 4966 - 4970.
-
KARNI, A. & SAGI, D. (1993). The time course of learning a visual skill. Nature 365 (6443), 250 - 252.
-
LEGGE, G.E., RUBIN. G.S., PELLI, D.G. & SCHLESKE, M.M. (1985). Psychophysics of reading--II. Low vision. Vision Research 25 (2), 253 - 265.
-
MITRA, S. ( 1985). Spatial contrast sensitivity in macular disorder. Documenta Ophthalmolugica 59(3), 247---267.
-
MORGAN, M.J., WARD, R.M. & CASTET. E. (1998). Visual search for a tilted target: Tests of spatial uncertainty models. Quarterly Journal of Experimental Psychology A 51 (2), 347 - 370.
-
PALMER, J. (1994). Set-size effects in visual search: The effect of attentioN is independent of the stimulus for simple tasks. Vision Research 34 (13), 1703 - 1721.
-
PELI, E., GOLDSTEIN. R.B., YOUNG, G.M., TREMPE, C.L. & BUZNEY, S.M. (1991). Image enhancement for the visually impaired. Simulations and experimental results. INVEStigative OphthalmoloGY and Visual ScieNCe 32 (8), 2337 - 2350.
-
PETTET, M.W. & GILBERT, C.D. (1992). Dynamic changes in receptive field size in cat primary visual cortex. Proceedings of the National AcademY of Sciences of the U.S.A. 89 (17). 8366 - 8370.
-
RAASCH, T.W. (1992). QuantiTative model of corneal astigmatism from topographic data. In NoniNvasiVE Assessment of the Visual System Technical Digest, 3, 24 - 27.
-
RAMACHANDRAN, V.S. & GREGORY. R.L. (1991). Perceptual tilling in of artificially induced scotomas in human vision. Nature 350 (6320), 699 - 702.
-
SAFRAN, A.B. & LANDIS, T. (1996). Plasticity in the adult visual cortex: Implications for the diagnosis of visual field defects and visual rehabilitation. Current Opinions IN Ophthalmology 7 (6). 53 - 64.
-
SAFRAN, A.B., ACHARD, O., DURET. F. & LANDIS, T. (1999). The "thin man" phenomenon: A sign of cortical plasticity following inferior homonymous paracentral scoTomas. British Journal oF Ophthalmology 83 (2), 137 - 142.
-
SCHUCHARD, R.A. (1992). Contrast discrimination in observers with vision loss. OSA Technical Digest Series 1, 100 - 103.
-
SCHUCHARD, R.A. (1997). Retinal locus for fixation. In SCANNINg Laser Ophthalmoscopy MicroscopY, and Tomography, ed. Elsner, A. E., pp. 11O - 127. New York: Plenum Publishing. 510
-
SCHUCHARD, R.A. & FLETCHER, D.C. (1994). Preferred retinal locus: A review with applications in low vision rehabilitation. Ophthalmology CliNics of North America 7, 243 - 256.
-
SCHWARTZ, s., MAQUET. P. & FRITH, C. (2002). Neural correlates of perceptual learning: A functional MRI study of visual texture discrimination. Proceedings of the National Academy of Sciences of the U.S.A. 99 (26). 17137 - 17142.
-
SUNNESS, J.S., APPLEGATE. C.A. & GONZALEZ-BARON, J. (2000). ImproveMent of visual acuity over time in patients with bilateral geographic atrophy from age-related macular degeneration. RETINa 20 (2), 162 - 169.
-
XING, J. & GERSTEIN, G.L. (1994). SimulaTIon of dynamic receptive fields in primary visual cortex. VisioN Research 34 (14), 1901 - 1911.
-
XING, J. & HEEGER, D.J. (2000). Center-surround interactions in foveal and peripheral vision. VisioN Research 40 (22). 3065 - 3072.

